Minotaur Quarterly - March 2026
Minotaur
Quarterly
March 2026
Minotaur Quarterly
March 2026

🧭 Quarter in review

The fund outperformed in January and February but gave the alpha back in March, leading to underperformance of 2.5% (-8.2% vs -5.8%) for the quarter. On a twelve-month basis, the fund outperformed by 6.1% (+15.3% vs +9.2%). See the March monthly for details on what drove underperformance last month.

Despite the challenging period, two things leave us more optimistic today than we were three months ago. The first is a real step-change in what Taurient can do. The AI advancements we described in the December quarterly have moved into daily practice this quarter, and the result is a significant uplift in our research ability. The clearest expression of that is that we can now look across whole industries and themes as a single integrated research project, rather than one stock at a time as before.

The second follows from the first. That uplift has led to a materially richer opportunity set than the one we had at the start of the quarter.

In this report, we cover two topics that are currently on our minds. The first is the acceleration we’re seeing in AI use and why AI infrastructure remains a large theme for us. The second is the rise of Chinese EV makers, and Leapmotor specifically, which became a top-ten position this month following meeting with the company in Shenzhen.

🧠 Agent Smith

The last three months have seen a significant acceleration in the use of AI. More people are using agents – software that loops, iterates, and chains subtasks and tool calls together. They burn tokens at multiples of a traditional ChatGPT conversation.

The clearly visible part of the AI story has been capacity. The four largest US hyperscalers – Microsoft, Alphabet, Amazon, and Meta – are collectively guiding to between US$635 and US$700 billion of capex in 2026, up from roughly US$140 billion just three years ago. Oracle signed a US$300 billion, five-year compute contract with OpenAI in September that begins delivering in 2027. Anthropic expanded its partnership with Google and Broadcom earlier this month to secure several gigawatts of next-generation TPU capacity, reportedly stepping up from around one gigawatt previously to roughly three and a half. It is a buildout without historical precedent.

The standard worry about capex on this scale is a “build it and they will come” one – whether the demand to fill it will actually show up. On the signals we can see so far, demand is running strong.

Anthropic reached an annualised revenue run rate of roughly US$14 billion in February, US$20 billion in March, and over US$30 billion by early April. That last step was a 50% jump in five weeks. More than 1,000 businesses are now each spending over a million dollars a year on Anthropic services, and that count doubled between February and April. Google’s gen-AI revenue is running about 400% ahead of a year earlier. In China, AI token consumption has risen from 100 trillion tokens per day at the end of 2025 to 140 trillion per day by the end of March.

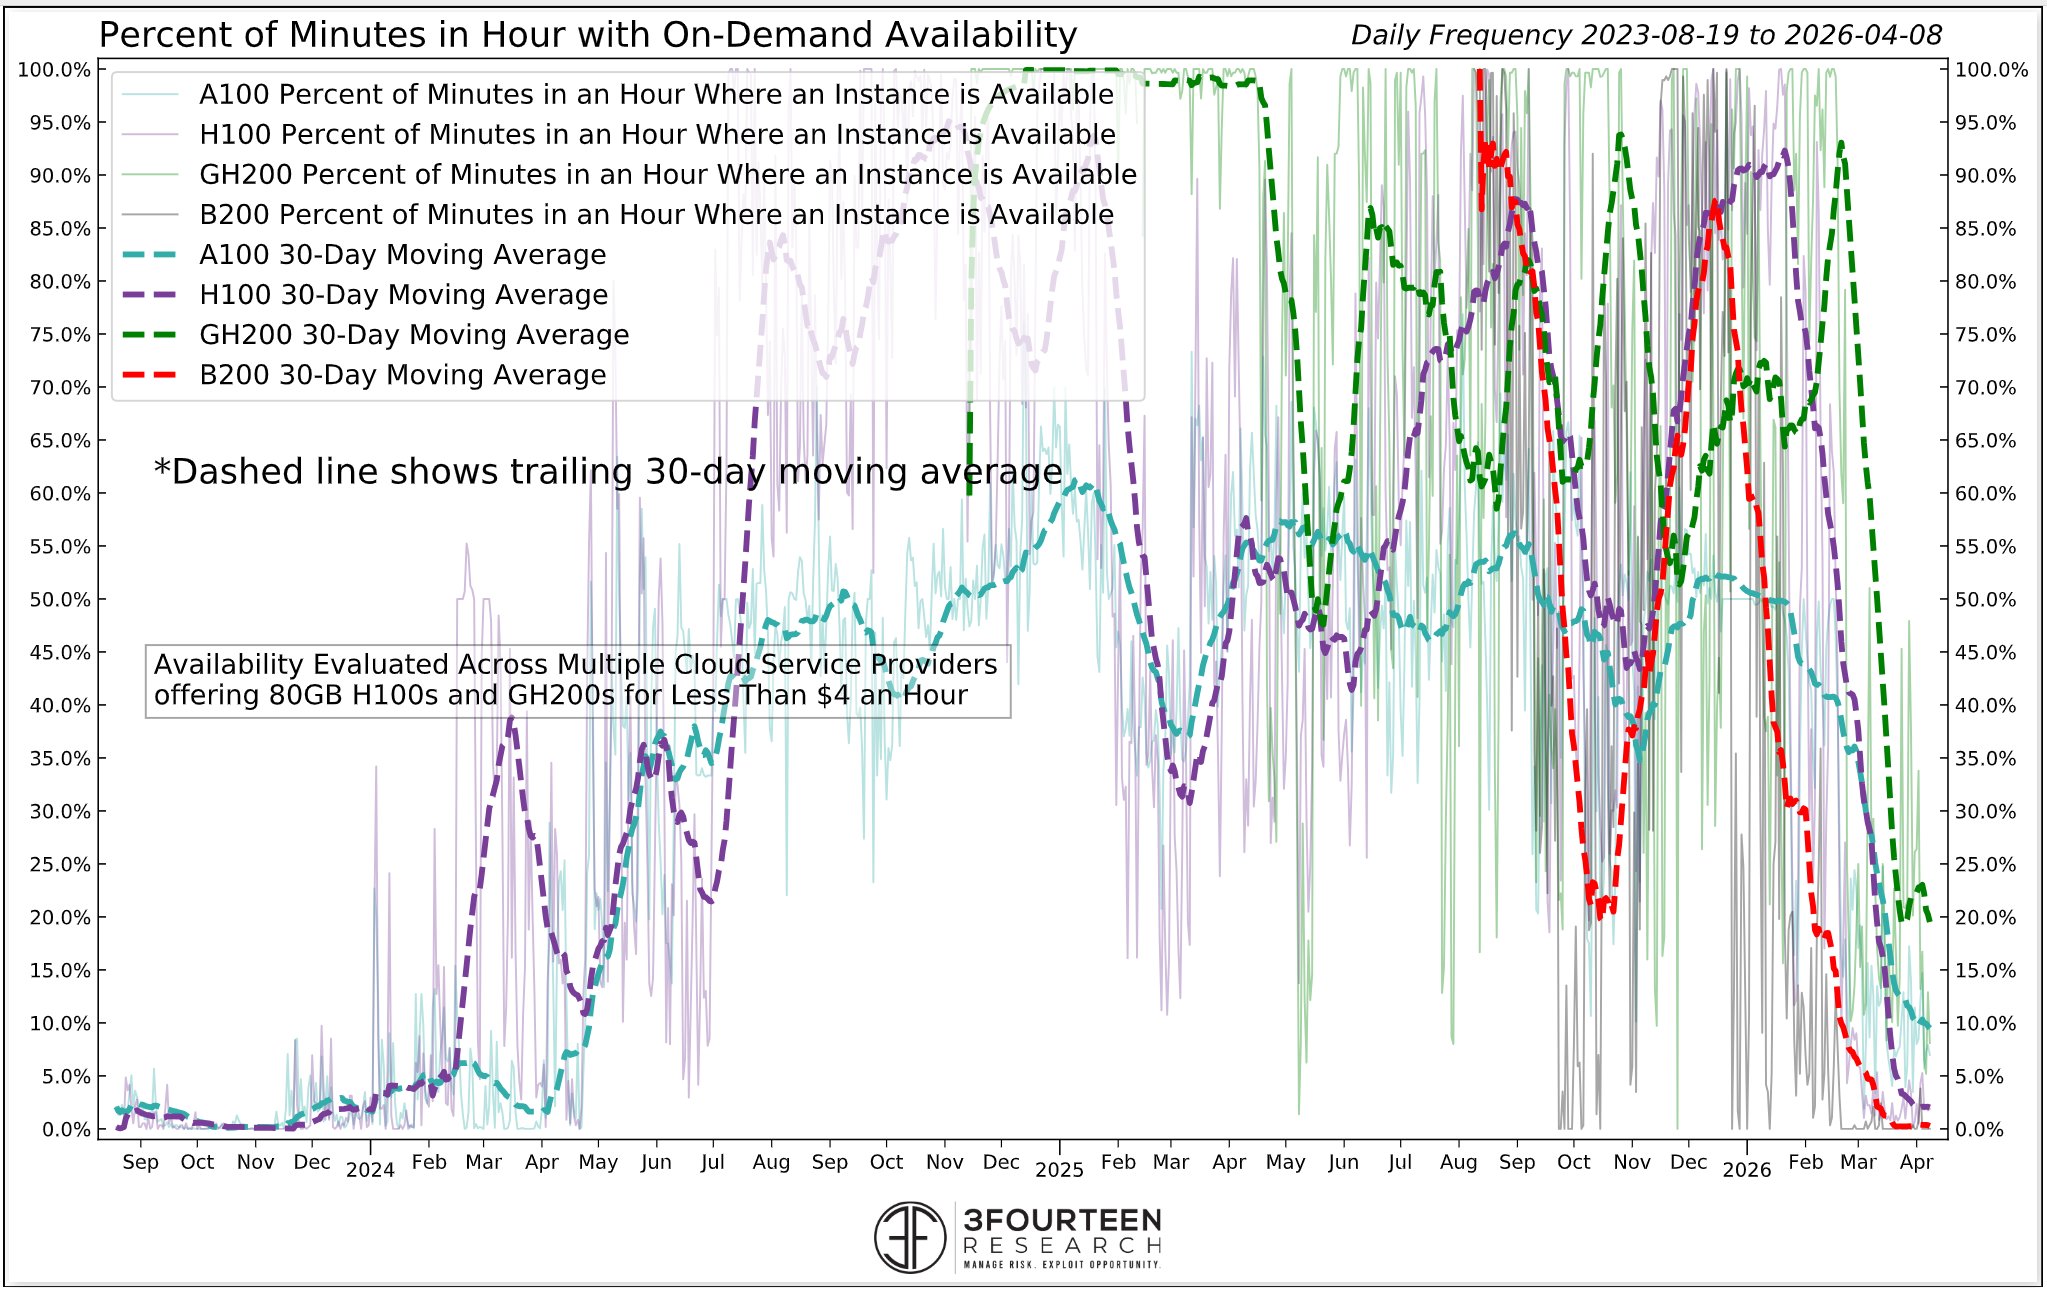
Capacity is not keeping up. The week that Claude Code topped the US App Store, Anthropic had its worst outage of the year. Microsoft attributed Azure’s recent deceleration to capacity constraints rather than demand softness. And an independent tracker of GPU availability across the neocloud providers shows on-demand H100 supply drying up again after a brief recovery in mid-2025.

On-demand GPU availability across the neocloud providers. Source: 3Fourteen Research (tweet).

We see the same picture in our own usage. Our spend at the top AI providers in the March quarter was up roughly 3x versus the December quarter, and the range of work we put them to has broadened materially.

Memory names sold off hard during the month of March on the back of Google’s TurboQuant paper, on the thesis that cheaper inference means less memory demand. We explained in the March monthly why we disagreed. We had added to SK hynix in February ahead of the move, and we added to Micron into the drawdown itself. Our view on Micron is that demand is strong enough and supply short enough to sustain earnings above US$100 per share in each of the next two years; the stock closed the quarter at US$337.84. By mid-April both SK hynix and Micron had retraced most of the fall – a sharp reversal from March down to April-MTD up. Moves of that kind have become a recurring feature of markets in 2026.

AI infrastructure remains our largest bet overall, expressed through memory names, through chip suppliers, and through pure-play AI infrastructure. Hut 8 is our clearest example in the last bucket – a position we added around the Anthropic-linked River Bend lease (written up in the December quarterly) and now levered directly to Anthropic’s trajectory, the most visible AI growth story in the market today, private or public. The stock is up significantly in the past month.

🚗 The Uniqlo of Auto

The train from Hong Kong West Kowloon to Futian takes fourteen minutes. That is how long it takes to cross from one of the most expensive cities in the world into Shenzhen, the city that builds much of the world. We were there for the Morgan Stanley China Summit, and one of the meetings we had specifically requested was with Leapmotor. We had owned BYD and Xiaomi for some time, and Chinese EVs were the segment where we were most underweight relative to our enthusiasm for the theme. Leapmotor was at the top of a short list of names we wanted to dive deeper on. We bought the stock shortly after the meeting. It is now one of the fund’s top-ten positions.

The shape of the industry

Before going further on Leapmotor itself, it is worth zooming out. The global auto industry is in the middle of a structural shift, and sectors visibly changing shape are where we most often find mispricings on both the long and short side.

In China, new energy vehicles (battery electric plus plug-in hybrid) now account for more than half of all new car sales. Five Chinese OEMs grew revenue 25% or more last year. Chery now earns more than half of its total revenue outside China. BYD’s export volumes rose 140%. In contrast, Tesla posted its first-ever annual delivery decline. Six of the seven major European OEMs reported shrinking revenue, with only Renault growing. Ford’s EV division lost about US$27,000 on every vehicle it sold. Cumulatively, Western automakers have now booked more than US$65 billion of EV-related write-downs over the past year, which is a large share of the total Western investment in the category.

Who's Growing? Revenue by OEM Home Region

CY2025 vs CY2024, 32 global automakers

Europe is the weakest region at −4.8% aggregate – driven by Mercedes (−9%), Volvo Cars (−11%), and Porsche (−10%).

Source: Company filings. Revenues converted to USD at approximate CY average exchange rates.

The interesting question for us is not whether Chinese EV makers can grow. That is settled. It is which of them are now scaling through to profitability. A handful are. Leapmotor recorded its first-ever annual profit, XPeng its first quarterly profit, NIO its first GAAP quarterly profit. The profitability leg has begun, and the market is still learning to tell the survivors apart from the rest.

This is the first time we have used Taurient to run a full initiation on every major auto OEM globally, covering over fifty companies in total. For each one, Taurient pulled the recent filings, worked through the earnings transcripts and presentations, and wrote the initiation from scratch. The shape of the industry we have just described is what fell out of it – a picture that would previously have taken a large team to piece together.

Leapmotor

A founder’s specific expertise often defines what a business can do better than its peers. Tobi Lütke at Shopify is an engineer who writes code himself, which is part of why Shopify has been one of the fastest companies to adopt AI as a first-class tool. Zhu Jiangming, who founded Leapmotor in 2015, had spent more than two decades as co-founder and chief technology officer of Dahua Technology, one of the world’s two largest security camera companies. When he left Dahua to start Leapmotor, he brought eighty senior hardware engineers with him. That is an unusual starting point in an industry where most of the new Chinese entrants were founded by software or internet executives, and most of what Leapmotor has built since follows from it.

Leapmotor is a vertically integrated manufacturer. The economics of vertical integration work the same way everywhere. Building more of the car yourself captures the Tier-1 supplier margins internally but requires heavier fixed investment upfront. The trade-off only pays back above a certain volume. Below the threshold the fixed costs hold you underwater; above it, each additional car is unusually profitable, because its marginal cost is lower than a less-integrated peer’s.

What makes Leapmotor interesting right now is that they’re just past the tipping point. Deliveries reached 597,000 vehicles last year, roughly Volvo Cars’ global scale, up 103% from a year before. Management are targeting one million units in 2026, which would take the company into Mazda territory. Gross margin has moved from -50% five years ago to +14.5% in 2025, exactly the trajectory you would expect to see from this kind of business as it scales. Leapmotor made its first-ever annual profit of CNY 540 million in 2025. While small, management have guided for around CNY 5 billion in 2026, roughly ten times that. Sell-side consensus is more conservative at about CNY 2.9 billion. Whichever number the year delivers, the direction is clear.

From −50% to Profitability

Leapmotor gross margin trajectory, 2020–2028E

Sources: Leapmotor annual reports; consensus estimates as at April 2026. We think consensus is low.

Underneath the margin curve is a cost structure that looks genuinely different. Leapmotor designs and builds about 65% of its bill of materials in-house, and is targeting 85%. Only BYD runs higher among listed auto OEMs, and does so at roughly four times Leapmotor’s volume; Tesla is around 46% in-house. All of this has been built rather than bought. Leapmotor has grown the in-house footprint organically or through joint ventures, with no acquisitions along the way, and the balance sheet carries no goodwill as a result. The whole footprint sits on a fixed-asset base of roughly CNY 11 billion, against BYD’s CNY 300 billion, in part because Leapmotor leans on government-leased land and buildings rather than owning the real estate outright. Only two land lots have been directly acquired since the 2022 IPO. Seventeen parts-and-components factories spread across Huzhou, Jinhua, and Hangzhou in Zhejiang feed the main assembly lines, close enough at the Jinhua end that battery packs and headlamps travel less than a kilometre from supplier to final assembly.

As a real-world anchor, Leapmotor’s small electric SUV, the B10, has been on sale in Australia since late 2025, priced from A$38,990 drive-away. The BYD Atto 3 starts at A$39,990 with a smaller battery. The MG S5 EV is A$40,990. The Tesla Model Y Premium RWD is closer to A$59,000. Carsales.com.au’s recent review, embedded below, describes the B10 as Australia’s “most affordable electric SUV” and presents it as unusually strong on equipment, perceived build quality, and price. It is not cheap because corners have been cut. It is cheap because of the cost structure underneath it.

Management describe the brand in one line. “Leapmotor is like Uniqlo in auto – good quality at the best price in its class.” Four vehicle platforms share most of their parts across price tiers from CNY 80,000 to CNY 350,000, each designed to offer the specification you would find at the tier above it. Most new Chinese EV founders want to build a Porsche. Zhu wants to build a Uniqlo. At this stage of the Chinese auto market, where the critical question is who can profitably serve the mass segment as it consolidates, we find the Uniqlo positioning the more defensible of the two.

On valuation, Leapmotor currently trades at around 14x forward earnings on management’s 2026 guidance, and around 24x the more cautious sell-side consensus. Against revenue growth of around 100%, a profitability inflection now behind it, and a cost structure that compounds with scale, we think it looks significantly undervalued.

🛢️ The oil tailwind

One secondary point is worth briefly noting. For several years the Chinese EV story has been one of share quietly taken from internal-combustion vehicles. That was always going to happen inside China, where NEV penetration just crossed 50%. The open question has been whether it plays out at the same pace in the rest of the world.

The Fastest Technology Adoption in Auto History

NEV share of new passenger car sales in China, annual (2013–2025)

54%
Full-year 2025
passenger penetration (CPCA)
10×
Growth in 5 years
5.7% (2020) → 54% (2025)
13.0M
NEV passenger cars
sold in 2025
<0.1%
Starting point
2013

Sources: IEA Global EV Data Explorer (2013–2024); CPCA (2025). Passenger vehicles only.

Our read, from the trip and the data, is that the pace outside China has quietly lifted. Brent crude has traded well above its pre-2024 range for most of the last year, driven in no small part by the Iran conflict, and higher fuel prices have sharpened household attention on running costs in a way they had not been for a long time. The economic gap between running an EV and a petrol car was always there; it was just not front of mind. Now it is. And Leapmotor already has around 900 distribution points across 40 markets established through its joint venture with Stellantis.

Zooming out

There is a version of this story that is just about a stock, and it is the version the headline implies. Leapmotor is the purest current expression of what is happening in global autos: the lowest unit cost outside BYD, a global distribution channel already in place through the Stellantis joint venture, and a net cash position that underwrites both. It trades like an ordinary auto company, which it is not.

The larger story is the one we would rather leave you with. Chinese automakers have quietly taken the global cost curve. Domestic Chinese buyers have crossed 50% NEV penetration, and the premium Western names are losing ground inside that market at pace. BMW’s local JV alone saw its battery-EV volumes cut nearly in half in a single year. The home markets of the Western OEMs are now being contested. The incumbents have already written down tens of billions. This is a once-in-a-generation shift in an industry most of our peers have written off as uninteresting, and we think it is far from uninteresting. Leapmotor is our largest expression of it, not our only one. We continue to own smaller positions in BYD and Xiaomi on the same theme, and we are short a handful of legacy names on the other side of it.

🏛️ Closing thoughts

The quarter ended with the portfolio carrying a meaningful drawdown from March. The fund nevertheless finished the period with the deepest bench of high-conviction ideas we have had since launch.

The Chinese EV work that took us to Shenzhen ended with Leapmotor as a top-ten position. The AI-infrastructure thesis has been reinforced by every new data point since the March sell-off, and we came through it with larger positions than we began the quarter with.

Epictetus once put it plainly: “Difficulties are things that show a person what they are.” March tested the process. The portfolio sits closer to where we want it to be than it did twelve weeks ago, and most of the reason is the work we did in those twelve weeks.

Interested in Minotaur Capital?

Subscribe to receive monthly performance updates and quarterly commentary.

We care about your privacy. Read our privacy policy.

© 2024 Minotaur Capital Management Pty Ltd (Minotaur). All rights reserved. See our Privacy Policy.

Minotaur Capital Management Pty Ltd (ABN 17 672 819 975) is a corporate authorised representative (CAR 1308265) of Minotaur Licensing Pty Ltd (ABN 86 674 743 198) (AFSL 557080). The Minotaur Global Opportunities Fund is issued by K2 Asset Management Ltd (ABN 95 085 445 094, AFSL 244393), a wholly owned subsidiary of K2 Asset Management Holdings Ltd (ABN 59 124 636 782).

The information in this website (the Information) has been prepared by Minotaur.


This information is for general information only and is not an offer for the purchase or sale of any financial product or services. The Information has been prepared for investors who qualify as wholesale clients under section 761G of the Corporations Act 2001 (Cth) (Corporations Act) or to any other person who is not required to be given a regulated disclosure document under the Corporations Act. The Information is not intended to provide you with financial or tax advice and does not take into account your objectives, financial situation or needs. Although we believe that the Information is correct, no warranty of accuracy, reliability or completeness is given, except for liability under statute which cannot be excluded. Please note that past performance may not be indicative of future performance and that no guarantee of performance, the return of capital or a particular rate of return is given Minotaur, K2 Asset Management or any other person. To the maximum extent possible, Minotaur, K2 Asset Management or any other person do not accept any liability for any statement in this Information.